- June 8, 2019
- Posted by: Taylor Johnson
- Category: Customizations

This post is part of a series that I am creating which go over Customizations as they relate to Microsoft Dynamics 365.
Clients will want an area that they can look at different components of their system at once. They need a visualization where they can quickly interpret meaningful data. One of the things that you will be creating after you have customized Views and Charts is Dashboards. Dashboards can also include more powerful resources like: PowerBi charts, and Microsoft Social Engagement insights.
Dashboards are not there just to be looked at, they can also be interacted with. You can click on the Charts and Views to get deeper into the data. Just like with Charts and Views, there are two different types of Dashboards, Personal and System.
Personal Dashboards
Created by a User
Can be shared with other Users or Teams
When sharing the Dashboard, ensure that all Charts and Views in the Dashboard are also shared
System Dashboards
Created by the System Customizer or System Administrator
Included in Solutions
Available to all Users, unless security privilege for that Dashboard has been restricted to security roles.
Microsoft Dynamics 365 comes with quite a few out of the box Dashboards. These Dashboards can be edited further or removed if you would like. Let’s go over how to create a Personal Dashboard.

Creating a Personal Dashboard
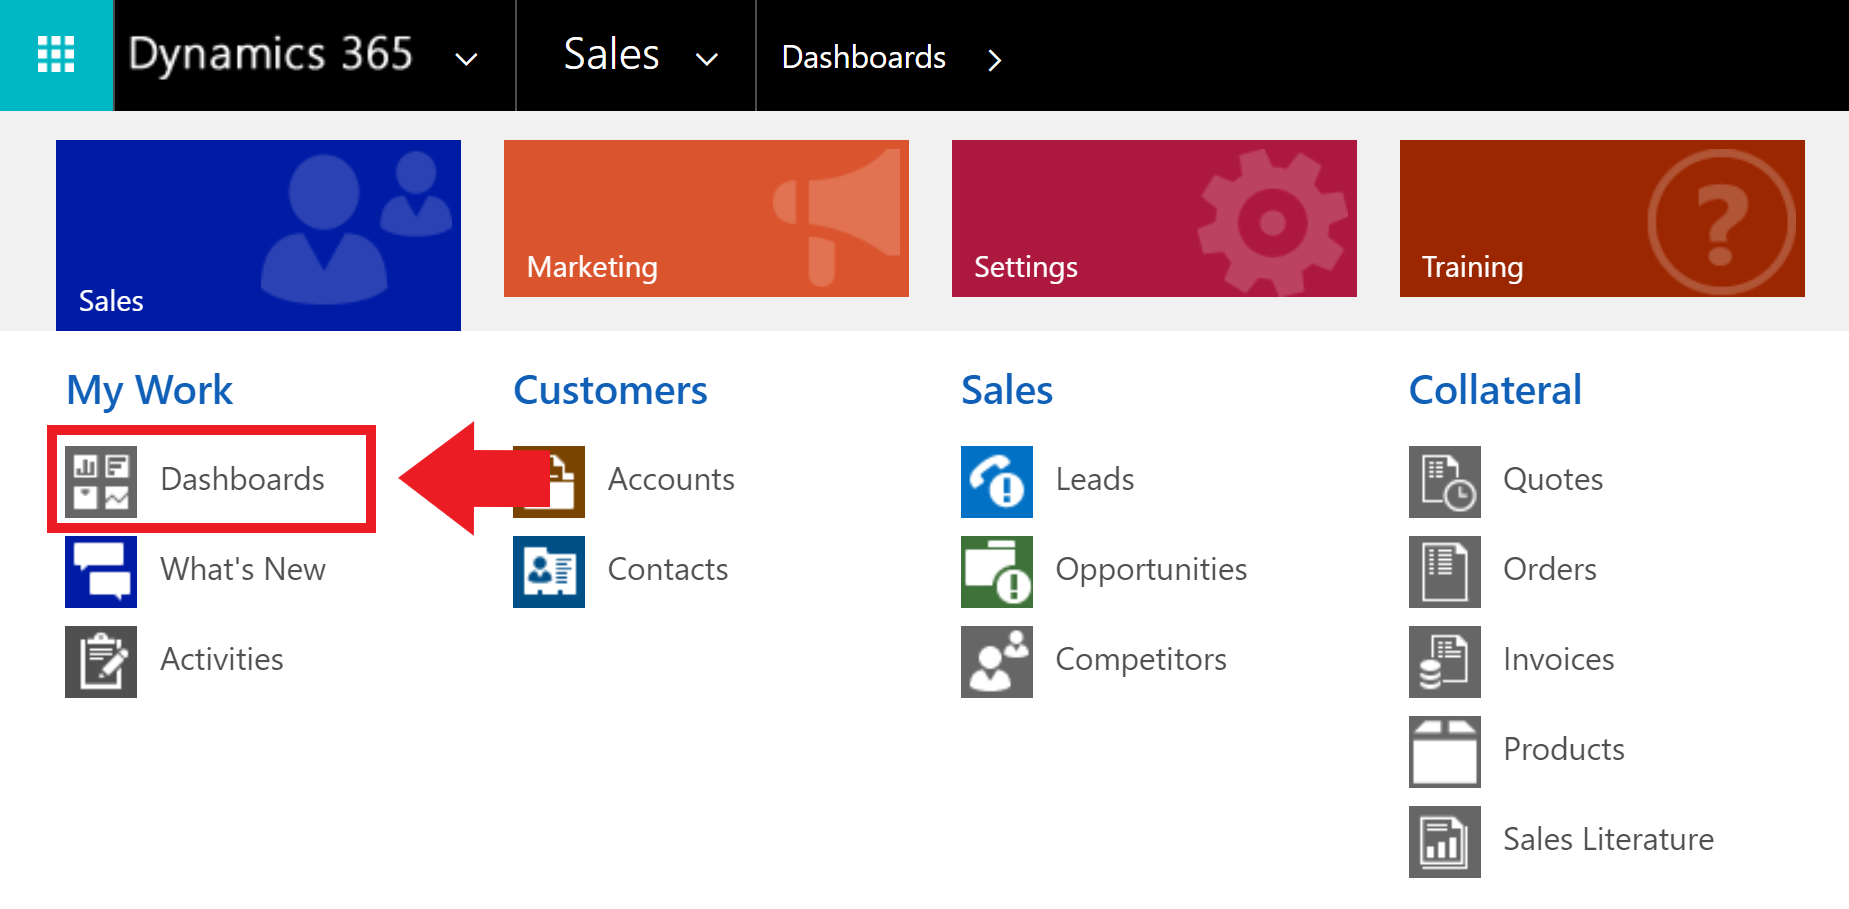
Go to Sales, then Dashboards. You will click the option that says “new.”

This should pop-up a query that asks for you to choose the layout of your new Dashboard. By default, there are a few pre-made layouts. It doesn’t really matter which one you choose, since all of it can be changed later.

Now you will be directed to the Dashboard editor. In the Dashboard editor, you can insert Charts, Views, iFames and Web Resources. We’re going to insert a couple of charts. Click on the box that you want to put the Chart in and press “Chart.”

Another dialog will ask for the specific

You can change the sizes of each of the visualizations in the Dashboards. Do this by pressing the “…” and the menu below will pop-up.

After all of this, the View we just made is populated below. We have an iFrame of the my blog on the left and a Chart of “All Active Accounts” by their “industry.”

Sharing Dashboards
Personal Dashboards can be shared with other Users or Teams. To do this select “Share Dashboard”.

A menu will populate, prompting you to add or remove users that you intend to share the Dashboard with. It also asks what type of privileges you would like to give those U

Creating System Dashboards
Creating a System Dashboard is very similar to creating a Personal Dashboard. The difference is that you need to create it in a Solution. Go to Settings, Solutions, Create a Solution, then scroll down to Dashboards. We will be creating a new Dashboard.

Note that when you create a System Dashboard, the Security should be set. Click on “Enable Security Roles.” Here you will be able to select which Security Roles will have access to this Dashboard.

Dashboards are very useful, yet not too hard to make. They require lots of thinking ahead of time to make them helpful. I was able to easily create the Dashboard in the image above. That image is just an example, it helps nobody right now because it’s not displaying the information that I need.
Get some practice!
The definitions are based from the Microsoft Dynamics 365 website. I encourage you to look at them. These documents are helpful when you want to learn more in depth on any subject.
