- February 5, 2019
- Posted by: Taylor Johnson
- Category: Customizations
This post is part of a series that I am creating which go over Customizations as they relate to Microsoft Dynamics 365.
Charts are extremely useful when monitoring performance. Charts can be displayed on Forms, Views, and Dashboards. Lots of companies end up liking Charts so much that they eventually want to adopt more powerful versions of them. This is where PowerBi can come into play. We won’t be going over PowerBi in this post, but I’ll talk about it later.
Dynamics 365 provides many charts for us to use. These charts include: column, area, line, bar, pie, funnel, tag, and doughnut.

It’s important to understand that charts will interact with the chosen view. If I have selected “My Accounts View,” the chart will interact with that information, not the “All Accounts.” There are two types of charts, Personal Charts and System Charts. Personal Charts are created by a user, while System Charts are created by a customizer. You can export a chart’s XML and re-import it after it has been customized. This allows you to choose many other chart formats and colors.
Personal Charts
Created by a User
Can be shared with other users or teams
Can be included in Personal Dashboards, but not System Dashboards
System Charts
Created by the System Customizer
Included in Solutions
Available to all Users
If you would like to apply a filter, you can choose to use top/bottom filters. This is helpful when you want the top 5 clients with relations to revenue.

Personal charts can be created in the Chart designer. These chart designers appear on most entity pages. Below we have an example of an account chart designer. In the chart designer we can select the criteria, select the chart type, choose how many rows we want, stack the chart, or add a series.

After we save the chart and close out of the chart designer, we can use the “…” to share or export the chart. When you share a chart, only the chart is shared, not the underlying data.
Data Aggregation
When working with Charts, we can choose to group multiple data types. This will allow us to find the average, count, max, min, or sum of a value.

We also can group the above calculations by different time periods. The different time periods are day, week, month, quarter, year, fiscal period and fiscal year. These different values can be set in the Settings.

Create a System Chart
When creating a System Chart, you do so by going to Settings, Customizations, Customizing the System, go to the “Account” Entity. I then went to the Charts and created a new Chart. For the Search Criteria, I made it look at “My Active Accounts,” with the “Account Name” on the X-axis and the “Status” on the Y-axis.

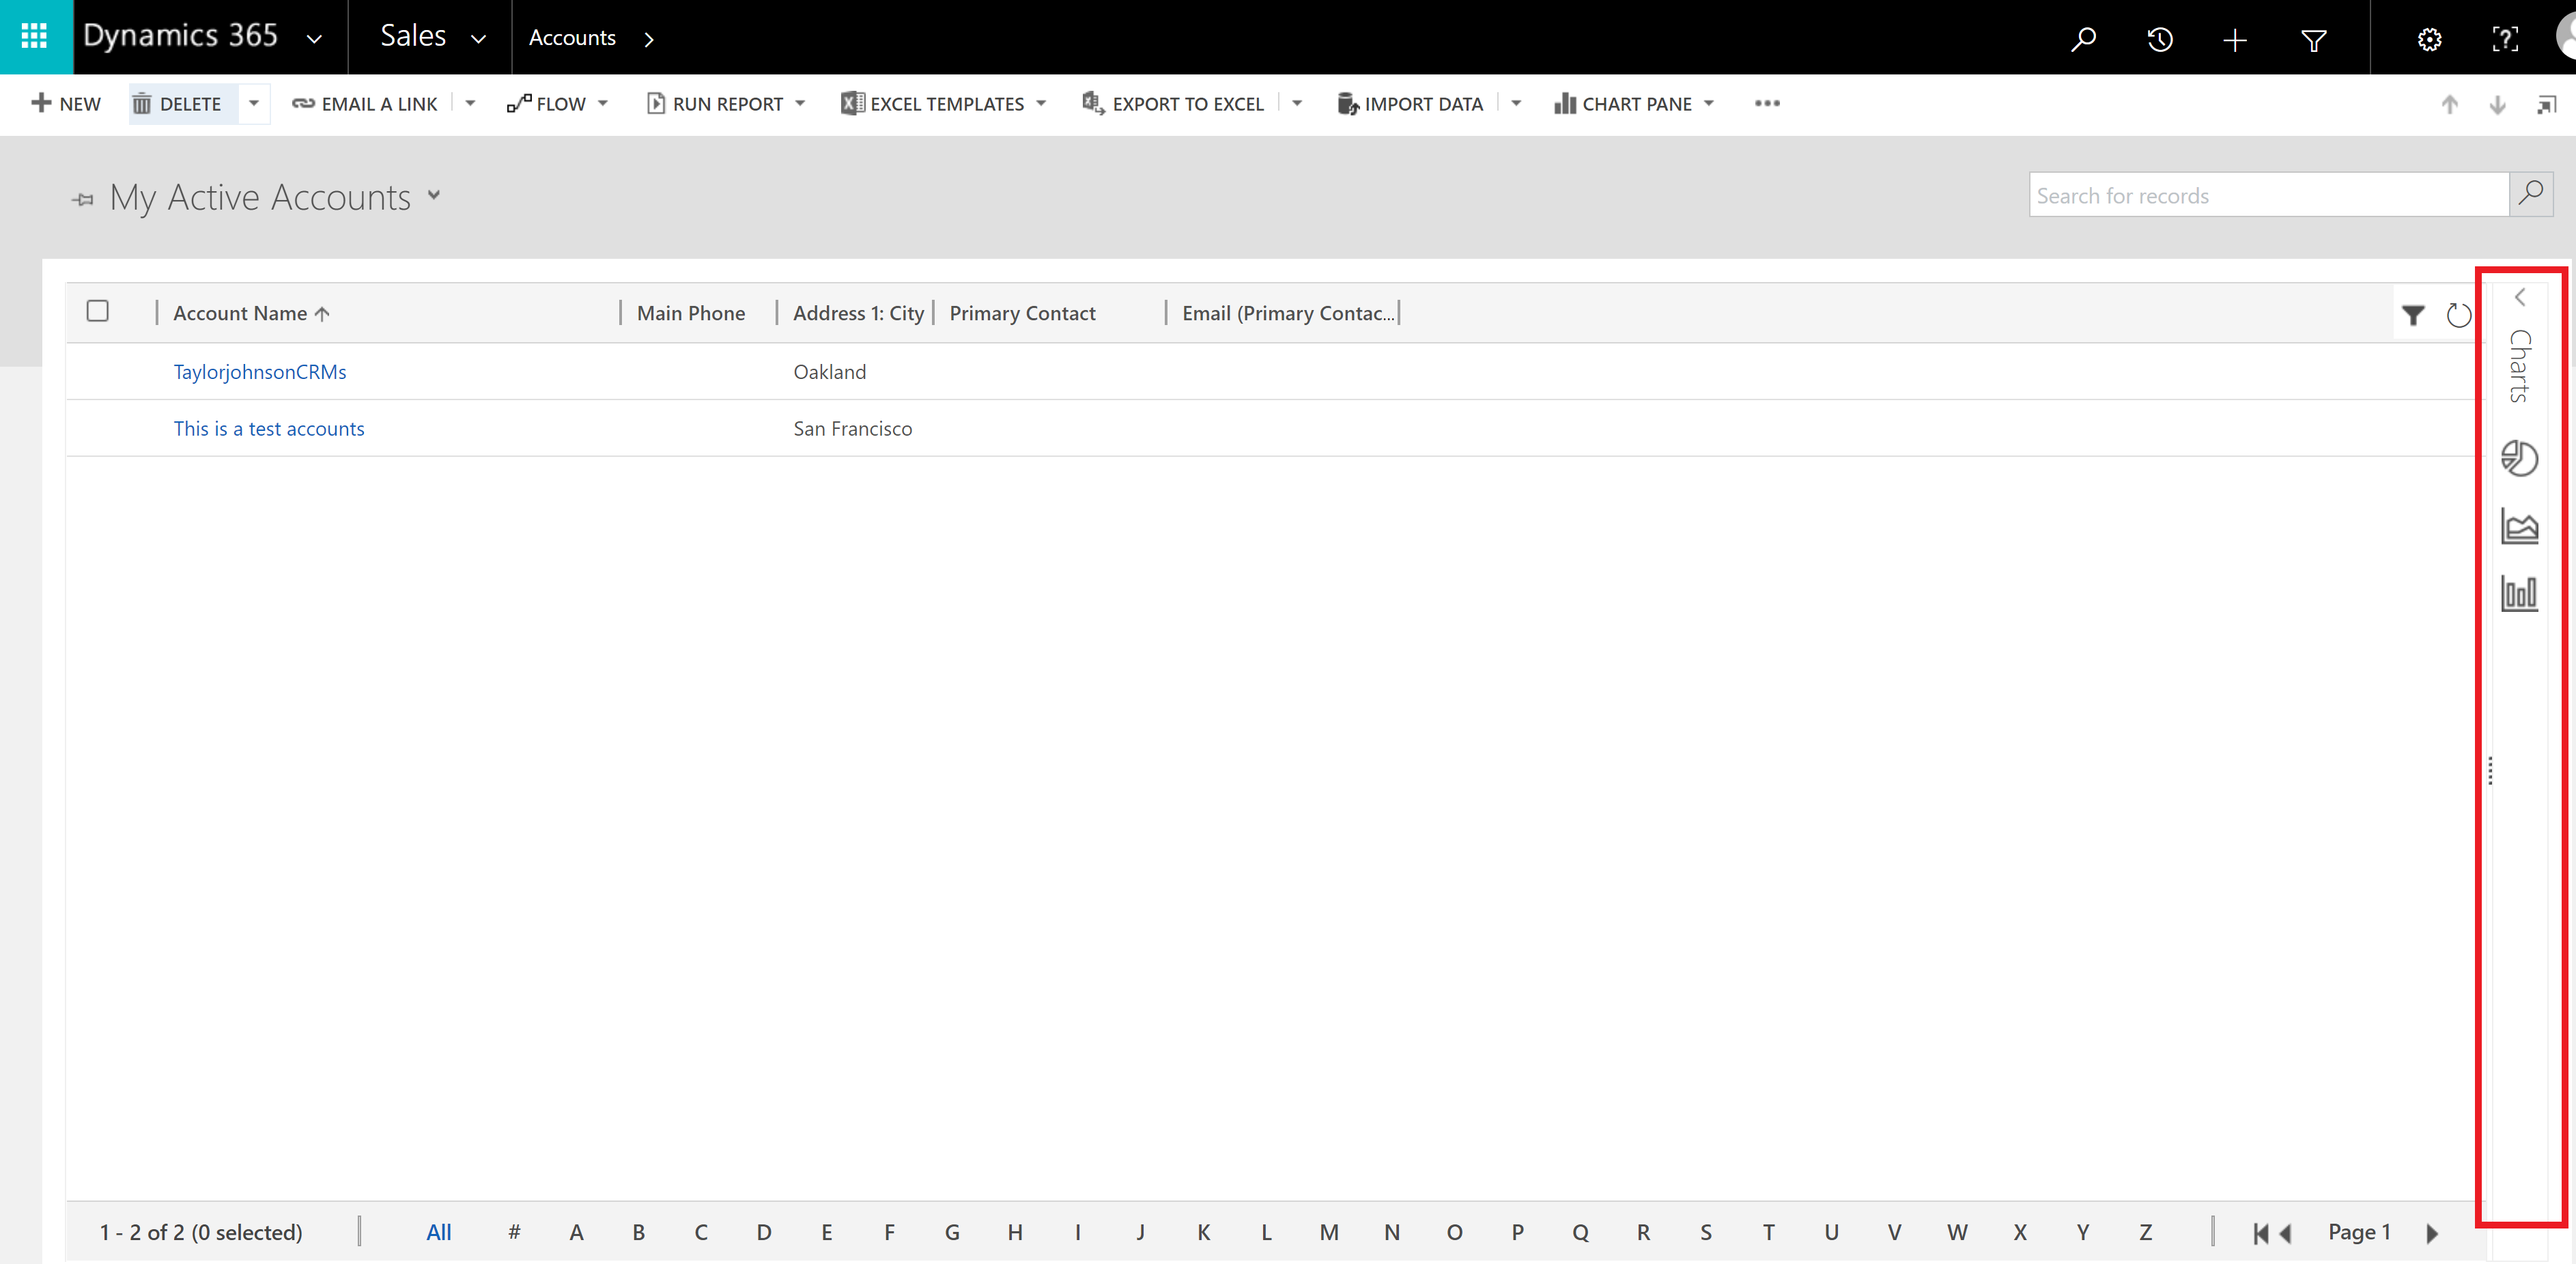
When looking at Charts, you can select from your User Charts (My Charts) or the System Charts. You can see the chart that we just created named “Status by Account Name.”

The Chart has populated for all active Users to see.

Charts are incredibly effective way of displaying information. Next we will be going over how to display a chart in a Dashboard.
The definitions are based from the Microsoft Dynamics 365 website. I encourage you to look at them. These documents are helpful when you want to learn more in depth on any subject.